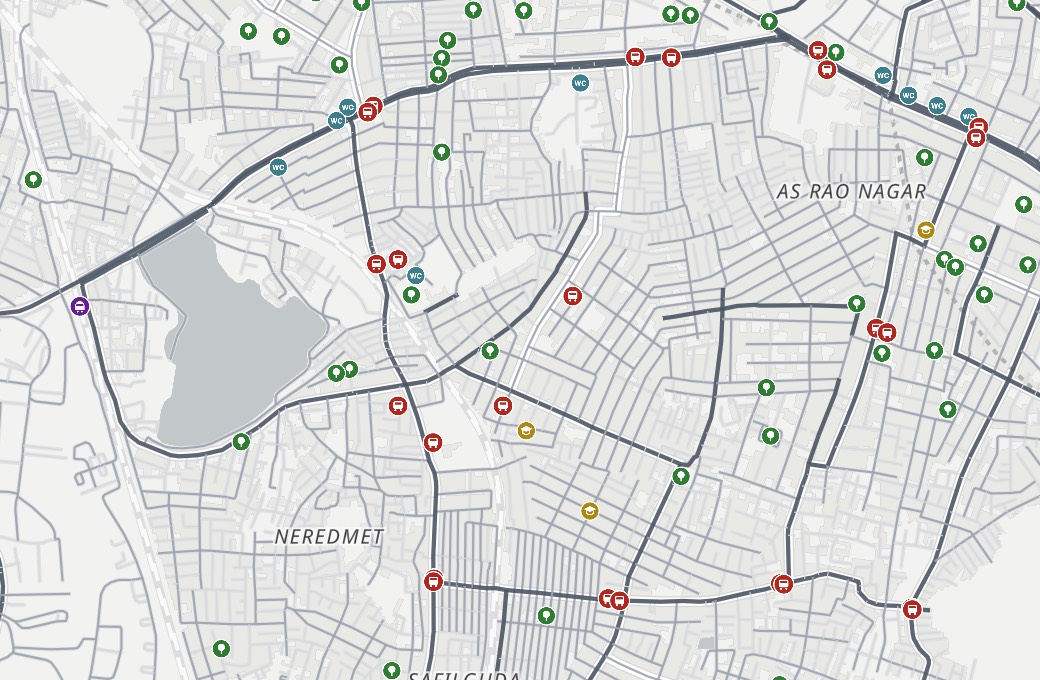
Tap a stop to see every stop you can reach without changing buses, and the routes that
serve it.
Route lines are drawn onto the road network automatically and can wander on long
routes. The open GTFS timetables behind them have gaps and errors of their own.
City
Wards
Banjara Hills · 214
Jubilee Hills · 215
Khairatabad · 216
Somajiguda · 217
Hyderabad›GHMC›Jubilee Hills▾
Pick a corporation, then a ward, from the breadcrumb at the bottom left, or click an
area on the map.Pick a corporation, then a ward, from search, or tap an
area on the map. The card shows how much of it is within a short walk of each amenity.
Zoom in to see how far you can walk
Legend
About
Accessibility Atlas
How walkable is your part of Hyderabad? This map shows how far you can get on
foot in 5, 10 or 15 minutes from any spot, what you can reach, and what the walk is like. Everything
is precomputed for every block-sized hexagon of the city and served as plain files, so the map is fast,
free to host, and needs no login.
Read the numbers right
Walk times are along streets, not as the crow flies, at an easy 4.5 km/h.
Shade is an average over daylight hours on four days spread across the year (46 sun positions), and is mapped for the four core corporations only.
Footpaths are not mapped yet. A ground survey and a data collection tool are coming soon.
MMTS (suburban rail) times come from a 2019 timetable.
Bus stops with one or two buses a day are shown faded and are not counted as access.
This is not a routing app and it is not live: it tells you what is within reach, not how to get
there right now.
Please read before using these numbers. This is a research tool under continuous development. The figures come from open data and automated models, and both can be wrong: amenities may be missing, misplaced or closed, street networks incomplete, and timetables out of date. Walk times are estimates for an average adult and will differ for children, older people and anyone with a disability. Check on the ground before relying on this for planning, funding or policy decisions. No warranty is given, and the Hyderabad Urban Observatory accepts no liability for decisions taken on the basis of it.
How to use it
Street. Move over the map, or tap on a phone, and the outlined area is everything you can
reach on foot within 5, 10 or 15 minutes. Pin a spot to see the nearest bus or metro stop, school,
park and public toilet, how shaded and steep the walk is, and what else is nearby. Streets can be
coloured by shade, tree cover, slope or road type.
City. The whole city coloured by walk time to the nearest of what you picked,
from teal (close) to orange (far). Pick a corporation or ward in the breadcrumb for its
figures.
Transit. Every bus, metro and MMTS stop, sized by how much service it actually gets.
Tap a stop to see every stop you can get to without changing buses, and the
routes that serve it.
Method
Walking. 4.5 km/h, slowed on slopes (Tobler's function). All roads count as walkable;
big roads must be walked around, not across. Walk times are along the network, never as the
crow flies.
Walking range. Precomputed for every H3 cell at resolution 10 (66 m edges, about
114 m across) for the 5, 10 and 15 minute budgets, and simplified for display. See "The grid
and the calculation" below.
Shade. A 5-metre surface model built from building heights and tree canopy, sampled at
46 sun positions across four dates (both solstices, an equinox and peak heat), all weighted
equally. Trees count as full shade. Shown as the share of sampled daytime a street is in shade.
Amenities. OpenStreetMap plus the GHMC public amenities register (2023). Public transport,
schools, parks and playgrounds, and public toilets get their own maps and headline walk times;
clinics, pharmacies, groceries, markets, banks, colleges, anganwadis and community halls are counted.
Public transport. Stops and timetables from open GTFS feeds. Bus stops are classed by
buses per day; stops with one or two buses a day, or rush-hour-only service, are shown faded and are
left out of the access maps so that "near a bus stop" means a usable one.
Area figures. "Share of homes and buildings" is the share of built-up area: only cells
with meaningful building cover count, so empty land does not flatter or penalise a ward.
Boundaries are the 2026 corporations, zones, circles and 300 wards; Secunderabad Cantonment, the
airport and BHEL are shown as separate areas.
Footpaths. OpenStreetMap knows footpaths for only a few percent of streets, so we do not
show that figure. A ground survey with a data collection tool is planned; results will appear
here as they come in.
The grid and the calculation
The hexagons. The city is divided into H3 hexagons at resolution 10. The "65 m" often
quoted is the length of one edge. A cell is about 114 m across from flat side to flat side,
132 m from corner to corner, and covers about 1.5 hectares, roughly one residential block.
The next coarser size (174 m edges, 10.5 hectares) would give two sides of a main road the
same walk time and turn the 5-minute ring into a blob. The next finer size (25 m edges) would
mean seven times as many cells with no better answers, since neighbouring cells on the same
street snap to the same point anyway.
Walk time from a cell. Three steps. First, the cell's centre is snapped to the nearest
junction or bend in the street network, built from OpenStreetMap ways split at every
intersection. A cell more than 300 m from any street is marked unreachable. Second, every
street segment gets a walk time: 4.5 km/h on the flat, slowed on slopes by Tobler's hiking
function, so a 5% grade costs about 15% of speed and a 10% grade about 30%. Slope comes from
the terrain model and exists only in the four core corporations; elsewhere streets are treated
as flat. Third, a shortest-path search runs outward from the snapped point with a 15-minute
cutoff. The 5, 10 and 15 minute outlines are the union of every segment reached in time,
widened by 30 m and simplified by 10 m for display, which is why they hug the streets rather
than filling blocks.
Walk to the nearest, and the counts. This runs the other way round. Every amenity is
snapped to the network and a 15-minute search runs outward from it. Each cell it reaches records
the time; the cell keeps the smallest per category as its "nearest", and counts each amenity
that arrived within 5, 10 and 15 minutes. Amenities of the same type within 40 m of each other
are merged first, with the GHMC record preferred over OpenStreetMap, so a pair of bus stops on
opposite sides of a road counts once.
What that means for accuracy. Everyone in a cell gets the time from its centre's snap
point. The far corner of a cell is at most about 65 m from that point, under a minute on foot,
which is within the one-minute precision the map shows. The larger errors are the ones listed
above: missing or misplaced amenities, gaps in the street data, and footpaths and crossings
that are not modelled yet.
What to treat with care
MMTS frequencies come from a 2019 timetable; treat them as indicative.
The Transit section is an experimental visualisation. Route lines are drawn onto the
road network automatically and can wander on long routes, and the open GTFS timetables they
come from have gaps and errors of their own.
Shade and building data cover the four-corporation urban core; the rest of HMDA has streets,
amenities and transit but no shade layer.
Amenity names and locations come from OpenStreetMap and the 2023 GHMC register; some are out of
date. Write to us with corrections.
Data sources
OpenStreetMap contributors (streets, parks, amenities, buildings) · GHMC public amenities
(2023) · TGSRTC bus GTFS (June 2026) · HMRL metro GTFS (July 2026) · MMTS GTFS (2019) · Meta / WRI 1 m
canopy height (Tolan et al. 2024) · Google Open Buildings 2.5D · FABDEM 30 m terrain · GHMC and HMDA
boundaries. Basemap: OpenFreeMap, OpenMapTiles, OpenStreetMap.
Who made this
Built by the Hyderabad Urban Lab as part of the Hyderabad Urban Observatory, alongside the Lake
Atlas and the weather dashboard. It is under continuous development; write to
hulf.observatory@gmail.com with corrections or ideas.